LLM Monitoring: How to Track AI Performance and Cost
LLM monitoring tracks four layers in production: performance, quality, cost and safety. What to measure in each, and where traces, evals and a proxy fit.
LLM monitoring is watching how an AI application behaves in production: how fast it answers, what each call costs, whether the answers are any good, and where it fails. The ordinary signals still apply — latency, errors, throughput — but they are not enough, because a model call can return a 200 and still be wrong, unsafe, irrelevant or far more expensive than it needed to be. The goal is not to log everything. It is a feedback loop that tells you which prompt, route, retrieval step or model to change next.
What LLM monitoring should measure
Four connected layers. Performance says whether the application is usable, quality whether the answer is acceptable, cost whether the experience is sustainable, and safety whether the model stays inside the product's rules. Cover each with a few signals, plus the reliability signals any production service needs:
- Performance — latency per call and at p95/p99, timeout rate, throughput.
- Reliability — API errors, retries, fallback use, failed tool calls.
- Quality — relevance, faithfulness to the supplied context, factuality, user ratings.
- Cost — input, output and cache tokens, and cost by model, feature and customer.
- Safety — prompt-injection attempts, personal data in prompts or responses, toxicity, policy violations.
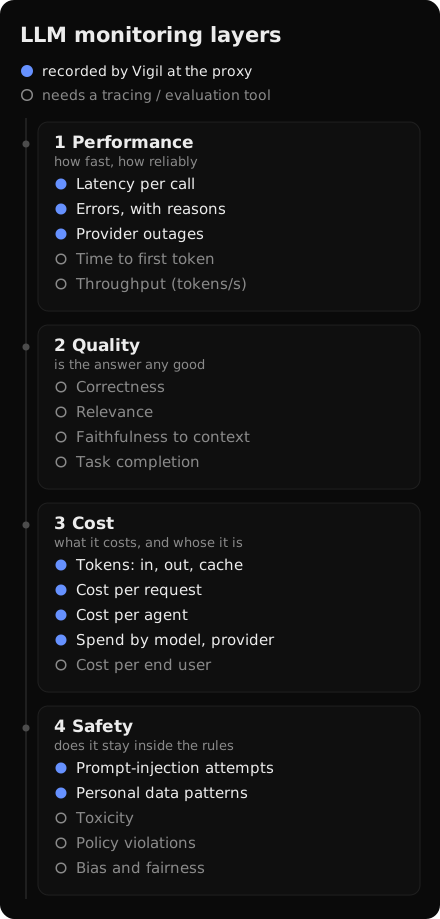
Latency and errors are visible to anything that sees the traffic. Quality and safety judgements need the content and a way to score it, which is why they live with tracing and evaluation tools: Langfuse's documentation describes a trace as the record of a request's whole lifecycle — LLM calls, retrieval steps, tool executions.
Monitoring and observability are different jobs
Monitoring answers "is something wrong right now?" Observability answers "why, and where did it start?" You need both, because dashboards rarely explain a weak answer. A dashboard shows latency rising after a release; a trace shows that the retrieval step now returns too many documents, or that the model makes tool calls it does not need. A quality score drops; the trace says whether a prompt, a model, a data source or a router changed.
Good observability keeps enough context to rebuild the request: the user input, prompt version, model parameters, retrieved documents, tool arguments and outputs, the response, tokens, cost and any evaluation. Arize Phoenix's tracing overview puts LLM calls, retrievals and tool steps on one timeline, with annotations for quality. Which of these a tool can see depends on where it stands — the trade-off is in-band versus out-of-band.
Build around traces, evaluations and feedback
A mature setup runs three loops. Traces record what happened. Evaluations estimate whether the output met expectations. Feedback adds the judgement automated checks miss.
Start with a trace ID on every request, passed through each model call, retrieval step, tool call and evaluation job, so a user complaint joins to the exact prompt, context, model and response behind it. Keep evaluations off the response path unless they are a safety gate: log the request, return the response, score it asynchronously. Match the evaluation to the task:
- Retrieval quality — did the system fetch relevant context?
- Faithfulness — does the answer stay grounded in that context?
- Task completion — did the response solve what the user asked?
- Format compliance — does the output follow the required schema, tone or structure?
- Safety and privacy — did it expose sensitive information or break policy?
- User outcome — did the user accept, edit, regenerate, escalate or give up?
This is where AI performance metrics outgrow infrastructure metrics. A fast response that confidently invents facts is not a success; a slower one that resolves the problem may be the better product.
Cost control starts with token visibility
LLM spend is shaped by traffic, model choice, prompt length, output length, retries, tool use and evaluation frequency. If you cannot see which features, prompts or routes consume the most tokens, cost reduction is guesswork. Attribute cost where each team acts: product by feature, engineering by model, prompt version and route, finance by customer, tenant or environment — and by end user, where your application passes a user identifier into its telemetry. Langfuse's token and cost tracking breaks spend down by model, user and use case, a good shape to aim for. To price a single call by hand, the token cost calculator works from published rates, each with its source.
Most savings come from small, repeated changes:
- Shorten prompts, keeping the instructions that matter. Duplicated policy text, stale examples and irrelevant context cost tokens on every call.
- Limit retrieved context. Send the most useful chunks, not every plausible match.
- Cap output length by task. A classification or a routing decision needs few tokens.
- Cache what repeats. A stable prompt prefix can be read from the provider's prompt cache at a fraction of the input price; an identical low-risk request can reuse a stored response. Two mechanisms, different risks.
- Route by complexity. Light models for simple tasks, stronger ones for ambiguous, high-value or safety-sensitive work.
- Watch retries. A retry storm inflates token usage and hides the reliability problem behind it.
Model routing turns monitoring into action
Model routing sends each request to the model, provider or workflow that fits its intent, complexity, cost, latency or risk — and a router is only as good as its signals. A support assistant might send password resets to a cheap model, troubleshooting to a stronger model with retrieval, and account questions to a guarded workflow. If a "simple" route shows rising escalations, adjust it; if a premium route is overused, cost data tightens the rules. Routing also lets traffic fail over when a provider is slow or down. Measure outcomes after routing, not just that the router decided.
Choose tools that match how you operate
The best LLM monitoring tools are the ones your team opens during release review and incident response. Some teams want open source and self-hosting, others a managed platform; many combine a layer for traces and evaluations with one for infrastructure and alerting. Check for:
- Full tracing — prompts, completions, retrieval, tools and cost on one timeline.
- Evaluation workflows — online and offline evals, scores attached to traces.
- Cost visibility — token usage by feature, route, environment and customer.
- Alerting — on quality drops, safety events, latency, errors and cost anomalies.
- Prompt and dataset management — production failures turned into test cases.
- Access controls and integration fit — for sensitive data, and for your stack.
Langfuse is built around tracing, prompts, evaluations and datasets; Phoenix is Arize's workflow for tracing, evaluation and debugging; Datadog brings LLM traces into a wider observability stack.
Where Vigil fits
Vigil is the cost and reliability layer, and it sits in the request path: you point your SDK's base URL at one Vigil URL and add a header, and every call is recorded on the way through.
- Cost per agent. Each call is priced from a rate table with a source for every rate, and attributed to the agent its header names. Where no verified rate exists, the cost shows as unknown, never as zero.
- Errors with reasons. The status, the provider's error code and a reason in plain words. The provider's own error message is never stored.
- Waste. An agent stuck repeating itself, a call costing more than three times that agent's median for the week, cache writes that expire before anything reads them.
- Prompt caching. On Anthropic, Vertex and Mistral, and on Bedrock with an API key, Vigil adds the caching instructions to each request itself; elsewhere it measures what the provider's own cache does.
History trimming and model routing are in testing. What Vigil does not do is judge answers: there are no quality evaluations and no retrieval tracing. Teams that need those pair it with a tool like Langfuse or Phoenix — the proxy for cost and failures, the tracer for meaning. Setup per provider is in the docs.
A practical rollout checklist
Start with what makes incidents diagnosable, then add quality scoring as the product matures:
- Baseline telemetry — latency, errors, model names, token counts, cost, request volume.
- Structured traces — prompt version, retrieval results, tool calls, parameters, output.
- Task-specific evaluations — a few that reflect what the product promises.
- Shared review — engineering, product, QA and domain reviewers on the same failures.
- Versioned prompts and routes — treated as production assets.
- Careful alerts — on sustained quality drops, cost spikes, safety events and severe failures, not on every blip.
- Findings fed back — recurring failures turned into test cases before the next release.
Monitoring works best when everyone argues from the same evidence rather than from anecdotes.
What to do
Pick the two layers you cannot see today — for most teams, cost per feature and the reason behind each failure — and instrument them this week: a trace ID on every request, tokens and cost per call, and every error with its code. Then add one task-specific evaluation, run asynchronously, before you build another dashboard.